Nebula Dashboard: A High-Performance Analytics Solution
A real-time analytics dashboard for SaaS platforms.
ReactD3.jsTailwindAnalytics
Nebula Dashboard: A High-Performance Analytics Solution
Overview
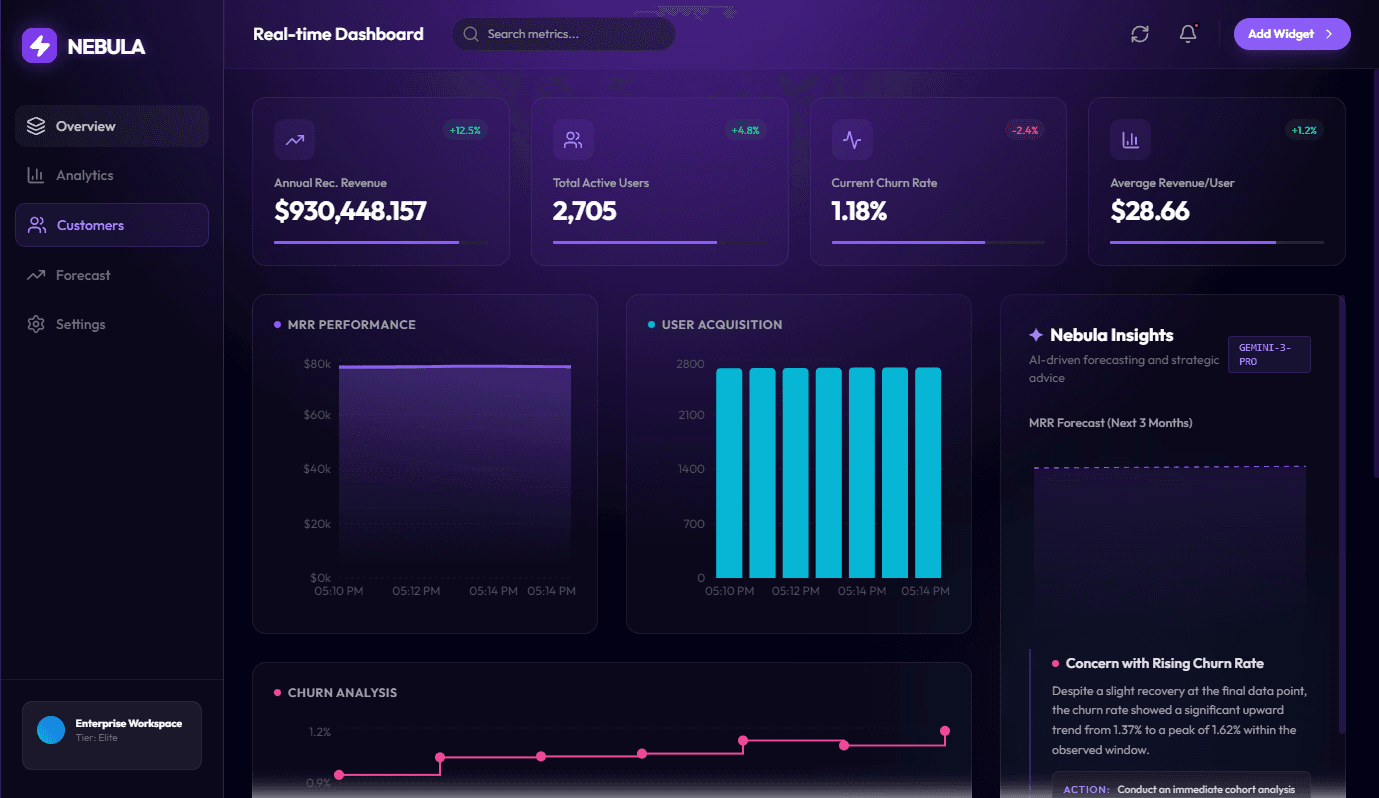
The Nebula Dashboard is a sophisticated, high-performance analytics platform meticulously crafted for SaaS founders. It provides a comprehensive, real-time view into critical business metrics, empowering decision-makers with instant insights into their company's health and growth trajectory. Designed with a focus on speed, accuracy, and user experience, Nebula transforms raw data into actionable intelligence, allowing founders to react swiftly to market changes and strategic opportunities.
Key Features
* Real-time Data Visualization: Instantly displays crucial SaaS metrics such as Monthly Recurring Revenue (MRR), Churn Rate, and User Growth. Data updates are near-instantaneous, ensuring founders always have the most current information at their fingertips.
* AI-Powered Insights: Leveraging Google Gemini, Nebula proactively analyzes historical data to predict future trends, identify potential risks, and highlight growth opportunities. These intelligent forecasts provide a strategic edge in planning and resource allocation.
* Customizable Widgets: Features a intuitive drag-and-drop interface that allows users to personalize their dashboard layout. Founders can arrange, resize, and select widgets to create a bespoke view that aligns with their specific analytical needs and priorities.
Technical Architecture & Challenges
The Nebula Dashboard is built upon React, a robust JavaScript library for building dynamic user interfaces, forming the core of its interactive and responsive frontend. This choice facilitated a component-driven architecture, promoting modularity and reusability across the application.
Developing Nebula presented several key architectural considerations and technical challenges:
* Real-time Data Integration: Achieving near-instantaneous updates for metrics like MRR and churn required careful implementation of real-time communication protocols, likely involving WebSockets to push data from the backend to the client as soon as it's available. This necessitated a highly optimized data pipeline to handle continuous streams of information without sacrificing performance.
* AI Service Integration: Integrating Google Gemini for predictive analytics involved complex API interactions. Challenges included securely authenticating with the AI service, formatting historical data for optimal model input, efficiently handling asynchronous prediction requests, and intelligently rendering the AI's insights in an understandable and actionable manner within the dashboard UI.
* Customizable User Interface: The drag-and-drop widget functionality demanded a sophisticated UI solution. This involved implementing a robust drag-and-drop library within the React ecosystem to manage widget positions, sizes, and states. Persistent storage of user-defined layouts, ensuring they are retained across sessions, added another layer of complexity to the state management and data persistence strategy.
* Performance Optimization: Given the "high-performance" requirement, extensive optimization techniques were employed. This included memoization for React components to prevent unnecessary re-renders, efficient data fetching strategies, and potentially virtualization for lists or tables displaying large datasets to maintain a smooth and responsive user experience even under heavy data load.
Conclusion
The Nebula Dashboard stands as a testament to building a powerful, user-centric analytics tool with modern web technologies. By skillfully integrating real-time data streams, advanced AI capabilities, and a highly customizable interface atop a React foundation, it delivers an unparalleled experience for SaaS founders. This project demonstrates proficiency in developing complex, high-performance applications that directly address critical business needs, showcasing strong frontend development and architectural design skills.
Development Roadmap
Phase 1
Phase 1: Project Definition & Architecture Design
Phase 2
Phase 2: Core Data Ingestion & Real-time Processing Engine Development
Phase 3
Phase 3: Backend API & Data Query Service Implementation
Phase 4
Phase 4: Frontend Dashboard UI & Visualization Development
Phase 5
Phase 5: System Integration & Comprehensive Testing
Phase 6
Phase 6: Deployment, Infrastructure Setup & Monitoring
Phase 7
Phase 7: Beta Launch, User Feedback & Iteration